A leap forward in combating financial crime with intuitive graph visualization
Use our lightning fast graph API to create stunning user-friendly and intuitive graph visualization for complex
relationships in high-velocity environments. Tailored made for fraud and network risk detection.Based on C++ graph databases we offer an API that runs an in-memory graph with low latency query times
and employs graph algorithms to make sense of our rich datasets, find critical nodes and detect anomalies.Compatible with the query language openCypher, the open source specification of query language Cypher® orginally developed by Neo4j,
and Bolt protocol.
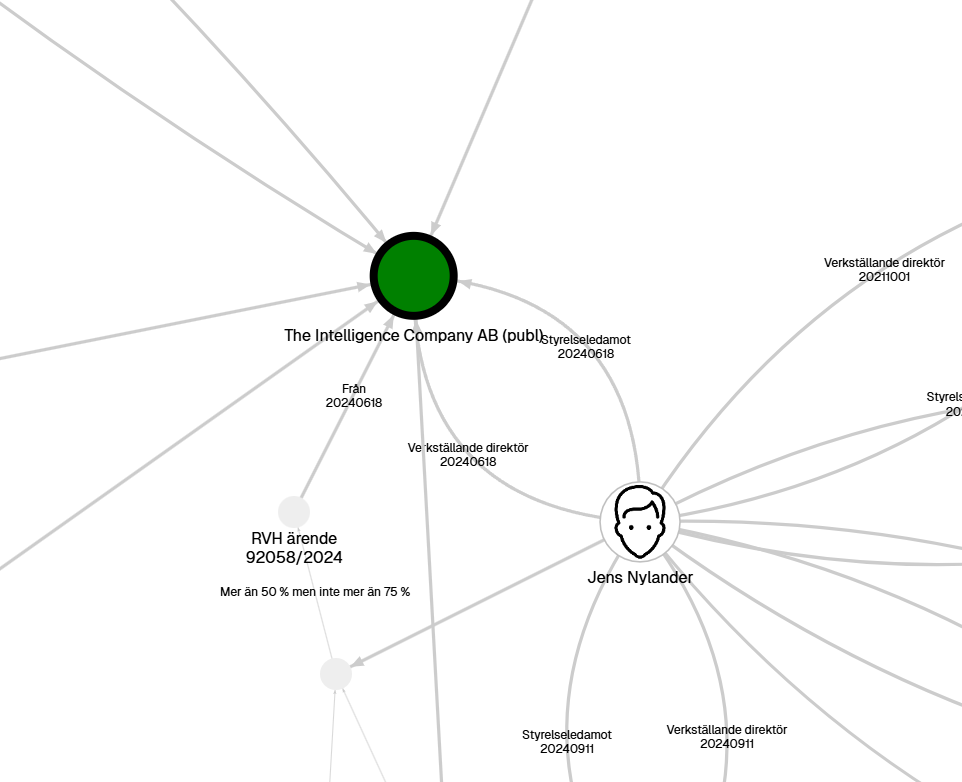
Use our graph analytics to enhance fraud detection and analyze complex relations. Use ready to use REST endpoints or
access our graph API by using Cypher queries.With Cyper you are able to quickly find and visualize over 100 million nodes and over 50 million edges representing our
large ecosystem of sources.
query example
Copy
MATCH (c:Company)WHERE c.id = 3503318OPTIONAL MATCH path1=(c)-[r1:REPRESENTATIVE_OF]-(:Person)-[r2:REPRESENTATIVE_OF]-(:Company)-[r3:REPRESENTATIVE_OF]-(:Person)-[r4:REPRESENTATIVE_OF]-(:Company)RETURN c,path1;
Example of company and persons and their relationships as both board members and beneficial owners.
This short example is everything you need, just replace the your_api_key with your key and pick the company you want to analyze (the company id).If you wish to use npm just install the Orb library by:
Copy
npm install @memgraph/orb
Copy
<!DOCTYPE html><html lang="en"> <head> <meta charset="UTF-8" /> <title>Orb | Simple graph</title> <!-- Direct reference non-minified --> <!-- <script src="dist/browser/orb.js"></script> --> <!-- Direct reference minified --> <!-- <script src="dist/browser/orb.min.js"></script> --> <!-- unpkg CDN non-minified --> <!-- <script src="https://unpkg.com/@memgraph/orb/dist/browser/orb.js"></script> --> <!-- unpkg CDN minified --> <script src="https://unpkg.com/@memgraph/orb/dist/browser/orb.min.js"></script> <style> #graph { border: 1px solid #e0e0e0; width: 100vw; height: 100vh; } </style> </head> <body> <div id="graph"></div> <script> window.addEventListener('DOMContentLoaded', async function () { // Avoid exposing your API key in requests directly in the browser. It's just here to demonstrate // how to get started. const response = await fetch( 'https://api.tic.io/datasets/companies/pick_your_id/graph?key=your_api_key' ); const graphJson = await response.json(); const container = document.getElementById('graph'); const orb = new Orb.Orb(container); orb.data.setup(graphJson); orb.view.render(() => { orb.view.recenter(); }); }); </script> </body></html>
You can apply styling based on various nodes and edge properties. This example just illustrates how simple it is to set size, color and title of the nodes.
Copy
<!DOCTYPE html><html lang="en"> <head> <meta charset="UTF-8" /> <title>Orb | Simple graph</title> <!-- Direct reference non-minified --> <!-- <script src="dist/browser/orb.js"></script> --> <!-- Direct reference minified --> <!-- <script src="dist/browser/orb.min.js"></script> --> <!-- unpkg CDN non-minified --> <!-- <script src="https://unpkg.com/@memgraph/orb/dist/browser/orb.js"></script> --> <!-- unpkg CDN minified --> <script src="https://unpkg.com/@memgraph/orb/dist/browser/orb.min.js"></script> <style> #graph { border: 1px solid #e0e0e0; width: 100vw; height: 100vh; } </style> </head> <body> <div id="graph"></div> <script> window.addEventListener('DOMContentLoaded', async function () { // Avoid exposing your API key in requests directly in the browser. It's just here to demonstrate // how to get started. const response = await fetch( 'https://api.tic.io/datasets/companies/pick_your_id/graph?key=your_api_key' ); const graphJson = await response.json(); const container = document.getElementById('graph'); const orb = new Orb.Orb(container); orb.data.setDefaultStyle({ getNodeStyle(node) { console.log(node); // Access various properties for the node - check documentation for more details const props = node.data.properties; let title = node.data.label; if (title == 'Company') return { color: '#FF0000', fontSize: 10, size: 6, label: `${props.name}`, }; else if (title == 'Person') return { color: '#00008B', fontSize: 10, size: 4, label: `${props.name}`, }; }, getEdgeStyle() { return { color: '#000000', width: 0.2, }; }, }); orb.data.setup(graphJson); orb.view.render(() => { orb.view.recenter(); }); }); </script> </body></html>