Before Getting Started
Prior to using the maps engine you need to ensure you have proper access by allowing domains to use the API. Each domain you use to access our maps needs to be added which is very simple. You add each domain by posting the domain to the https://api.tic.io/teams/tiles/cors endpoint. If you want to access in development mode you can also add your localhost:port.cURL
Getting Started
This example shows how you get started with MapLibre GL JS in a webpage. Include the JavaScript and CSS files in the head of your HTML file.Draw additional details
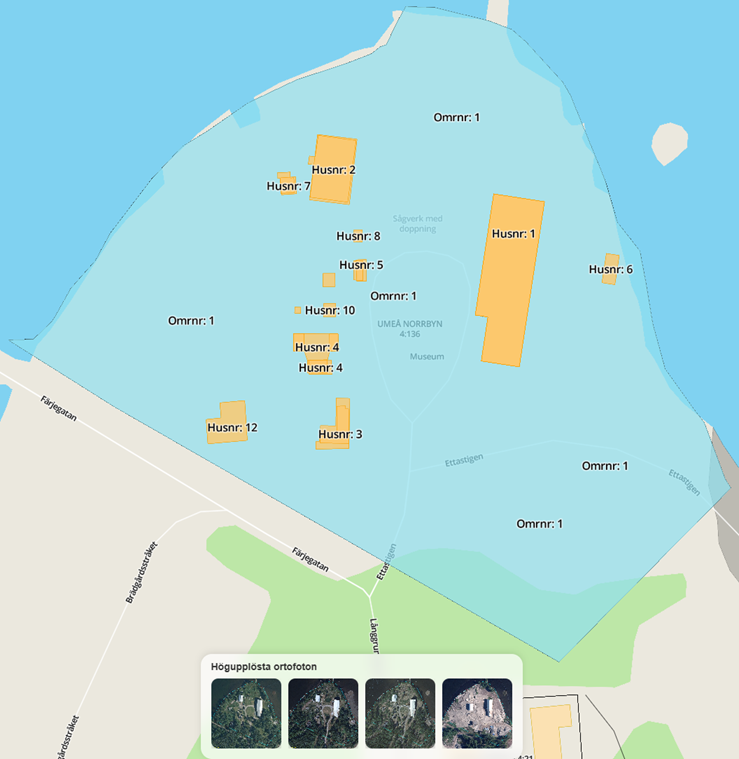
Property borders and buildings are by default included in the style but if you wish to draw areas and greater details about building numbers, usage type etc you can download the property details from https://api.tic.io/datasets/properties/se/uuid. This endpoint gives you additional data and areas. In the example below we are adding four(4) layers:- Areas
- Building parts (already included in the default style)
- Building parts text (number)
- Areas text (number)
Custom Styles
You can copy the style that we provide and make your own adjustments. We recommend using Maputnik which is a visual editor for MapLibre and MapBox style specifiation. It allows you to make modifications to your style and save the json style sheet and host it yourself. Each source object in the style reference our tileserver, tiles2.tic.io, which requires CORS. Therefore ensure you have added your domain to the API. Each URL consists of the following format which contains four(4) parts in the URL that should be replaced https://tiles2.tic.io/database.schema.table.column e.g database, schema, table and column. You have access to the following databases that are updated daily and runs on PostGIS with PostgreSQL. The tile server serves tiles cached and it’s extremley fast
Check next section for a full data dictionary.