> ## Documentation Index
> Fetch the complete documentation index at: https://docs.tic.io/llms.txt
> Use this file to discover all available pages before exploring further.
# Vector Maps
> Daily-updated vector map tiles for Sweden — property, address, road, and environment layers. Works with Mapbox and MapLibre.
We provide advanced but simple to use vector maps with styles for displaying rich data about properties, addresses, roads and environment and many other things. You can use Mapbox or
MapLibre GL JS to render the maps in both web and mobile apps.
Maps are updated daily and hot swapped.
## Before Getting Started
Prior to using the maps engine you need to ensure you have proper access by allowing domains to use the API. Each domain you use to access our maps needs to be added which is very simple. You
add each domain by posting the domain to the [https://api.tic.io/teams/tiles/cors](https://api.tic.io/teams/tiles/cors) endpoint. If you want to access in development mode you can also add your localhost:port.
```bash cURL theme={null}
curl \
--request POST
--header "Content-Type: application/json"
--header "x-api-key:your_api_key"
--data '{
"Domain": "http://mydomain.com"
}'
https://api.tic.io/teams/tiles/cors
```
## Getting Started
This example shows how you get started with MapLibre GL JS in a webpage.
Include the JavaScript and CSS files in the head of your HTML file.
```HTML theme={null}
```
Include the following code in the body of your HTML file.
```HTML theme={null}
```
## Draw additional details
Property borders and buildings are by default included in the style but if you wish to draw areas and greater details about building numbers, usage type etc you
can download the property details from [https://api.tic.io/datasets/properties/se/uuid](/api-core/properties/details). This endpoint gives you additional
data and areas.
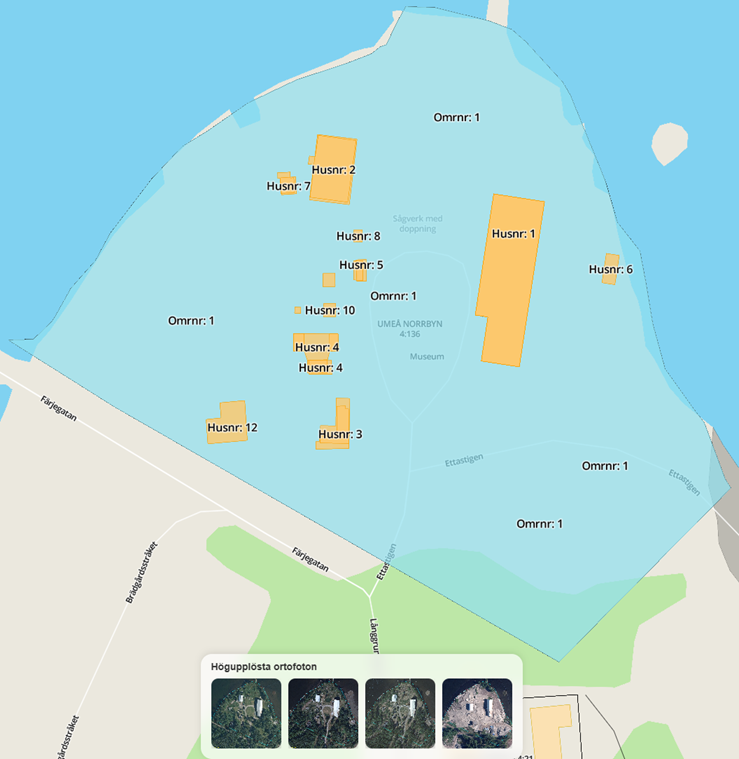
In the example below we are adding four(4) layers:
* Areas
* Building parts (already included in the default style)
* Building parts text (number)
* Areas text (number)
Result will look like the example below where the area is filled with light blue opacity and buildings are drawn in yellow adding the text number.
For simplicity we are using Lodash.
Include the JavaScript and CSS files in the head of your HTML file.
```HTML theme={null}
```
```HTML theme={null}
```
## Custom Styles
You can copy the style that we provide and make your own adjustments. We recommend using [Maputnik](https://maputnik.github.io/) which is a visual editor for
MapLibre and MapBox style specifiation. It allows you to make modifications to your style and save the json style sheet and host it yourself.
Each source object in the style reference our tileserver, tiles2.tic.io, which requires CORS. Therefore ensure you have added your domain to the API. Each URL consists of
the following format which contains four(4) parts in the URL that should be replaced [https://tiles2.tic.io/database.schema.table.column](https://tiles2.tic.io/database.schema.table.column) e.g database, schema, table and column.
You have access to the following databases that are updated daily and runs on PostGIS with PostgreSQL. The tile server serves tiles cached and it's extremley fast
| Database | Description |
| ----------------------- | ---------------------------------------------------------------------------------------------- |
| lm\_belagenhetsadress | Contains all information relating to an address |
| lm\_fastighetsindelning | Contains all information relating to an property |
| lm\_top1m | Contains topography 1:1M |
| lm\_top10 | Contains topography 1:10 |
| lm\_top10 | Contains topography 1:10 |
| naturalearth | Contains [Natural Earth](https://www.naturalearthdata.com/) |
| ormeo | Contains extended databases such as the EBH which is a national database of contaminated areas |
Check next section for a full data dictionary.
## Data Dictionary
Each databases consists of geometric tables and in total they are 248. Each table then contains a range of columns that can be used to be displayed on the map. For simplicity we are adding
a full data dictionary in PDF (582 pages) that you can download and easier search in and pick the fields you want to display.
[Download the data dictionary here](https://content.tic.io/tic/DataDictionary_20250720201303.pdf)
Adding a source layer is very simple in the style sheet and we have made an example below.
Let's say you want to show railroads in the map (enabled by default in our stylesheet), you check the PDF-dictionary and find that there is a table called ralstrafik (English: rail roads)
and the column geom contains the geometry of the railroads.
Just add a source object with the nickname "ralstrafik" and you are done:
```json theme={null}
"ralstrafik": {
"type": "vector",
"url": "https://tiles2.tic.io/lm_top10.table.public.ralstrafik.geom"
},
```
This should be interpreted as
Database = lm\_top10
Schema = public
Table = ralstrafik
Column = geom
Please note that the data directory contains a suffix on the databases in the
format \_YYYYMMDD which should NOT be included in the URL. It just shows when
the table was most recentley updated
 For simplicity we are using Lodash.
Include the JavaScript and CSS files in the head of your HTML file.
```HTML theme={null}
```
```HTML theme={null}
```
## Custom Styles
You can copy the style that we provide and make your own adjustments. We recommend using [Maputnik](https://maputnik.github.io/) which is a visual editor for
MapLibre and MapBox style specifiation. It allows you to make modifications to your style and save the json style sheet and host it yourself.
Each source object in the style reference our tileserver, tiles2.tic.io, which requires CORS. Therefore ensure you have added your domain to the API. Each URL consists of
the following format which contains four(4) parts in the URL that should be replaced [https://tiles2.tic.io/database.schema.table.column](https://tiles2.tic.io/database.schema.table.column) e.g database, schema, table and column.
You have access to the following databases that are updated daily and runs on PostGIS with PostgreSQL. The tile server serves tiles cached and it's extremley fast
| Database | Description |
| ----------------------- | ---------------------------------------------------------------------------------------------- |
| lm\_belagenhetsadress | Contains all information relating to an address |
| lm\_fastighetsindelning | Contains all information relating to an property |
| lm\_top1m | Contains topography 1:1M |
| lm\_top10 | Contains topography 1:10 |
| lm\_top10 | Contains topography 1:10 |
| naturalearth | Contains [Natural Earth](https://www.naturalearthdata.com/) |
| ormeo | Contains extended databases such as the EBH which is a national database of contaminated areas |
Check next section for a full data dictionary.
## Data Dictionary
Each databases consists of geometric tables and in total they are 248. Each table then contains a range of columns that can be used to be displayed on the map. For simplicity we are adding
a full data dictionary in PDF (582 pages) that you can download and easier search in and pick the fields you want to display.
[Download the data dictionary here](https://content.tic.io/tic/DataDictionary_20250720201303.pdf)
Adding a source layer is very simple in the style sheet and we have made an example below.
Let's say you want to show railroads in the map (enabled by default in our stylesheet), you check the PDF-dictionary and find that there is a table called ralstrafik (English: rail roads)
and the column geom contains the geometry of the railroads.
Just add a source object with the nickname "ralstrafik" and you are done:
```json theme={null}
"ralstrafik": {
"type": "vector",
"url": "https://tiles2.tic.io/lm_top10.table.public.ralstrafik.geom"
},
```
This should be interpreted as
Database = lm\_top10
Schema = public
Table = ralstrafik
Column = geom
For simplicity we are using Lodash.
Include the JavaScript and CSS files in the head of your HTML file.
```HTML theme={null}
```
```HTML theme={null}
```
## Custom Styles
You can copy the style that we provide and make your own adjustments. We recommend using [Maputnik](https://maputnik.github.io/) which is a visual editor for
MapLibre and MapBox style specifiation. It allows you to make modifications to your style and save the json style sheet and host it yourself.
Each source object in the style reference our tileserver, tiles2.tic.io, which requires CORS. Therefore ensure you have added your domain to the API. Each URL consists of
the following format which contains four(4) parts in the URL that should be replaced [https://tiles2.tic.io/database.schema.table.column](https://tiles2.tic.io/database.schema.table.column) e.g database, schema, table and column.
You have access to the following databases that are updated daily and runs on PostGIS with PostgreSQL. The tile server serves tiles cached and it's extremley fast
| Database | Description |
| ----------------------- | ---------------------------------------------------------------------------------------------- |
| lm\_belagenhetsadress | Contains all information relating to an address |
| lm\_fastighetsindelning | Contains all information relating to an property |
| lm\_top1m | Contains topography 1:1M |
| lm\_top10 | Contains topography 1:10 |
| lm\_top10 | Contains topography 1:10 |
| naturalearth | Contains [Natural Earth](https://www.naturalearthdata.com/) |
| ormeo | Contains extended databases such as the EBH which is a national database of contaminated areas |
Check next section for a full data dictionary.
## Data Dictionary
Each databases consists of geometric tables and in total they are 248. Each table then contains a range of columns that can be used to be displayed on the map. For simplicity we are adding
a full data dictionary in PDF (582 pages) that you can download and easier search in and pick the fields you want to display.
[Download the data dictionary here](https://content.tic.io/tic/DataDictionary_20250720201303.pdf)
Adding a source layer is very simple in the style sheet and we have made an example below.
Let's say you want to show railroads in the map (enabled by default in our stylesheet), you check the PDF-dictionary and find that there is a table called ralstrafik (English: rail roads)
and the column geom contains the geometry of the railroads.
Just add a source object with the nickname "ralstrafik" and you are done:
```json theme={null}
"ralstrafik": {
"type": "vector",
"url": "https://tiles2.tic.io/lm_top10.table.public.ralstrafik.geom"
},
```
This should be interpreted as
Database = lm\_top10
Schema = public
Table = ralstrafik
Column = geom